Beat the Google Analytics to GA4 deadline – there is an alternative

Google’s Universal Analytics (UA) is the most widely used traffic analysis tool in the world — but if you’re reading this article, you probably already know that.

Earlier this year, Google announced that UA will sunset in July 2023, forcing users to switch to Google Analytics 4 (GA4). So, from July 1st, existing UA tracking will stop processing new hits, meaning that you as a marketer will no longer be able to track data on your customers through the old system.

Fall-out for marketers

The potential fall-out from this is obvious for marketers focused on Marketing attribution efforts in order to maximise marketing returns and revenue growth by analysing and pinpointing the most successful marketing channels and campaigns.

Google UA itself had major limitations with sampled data, no integration with offline channels, and blunt attribution methods. Also, somewhat mysteriously, Google-owned media was favoured over other channels in reporting.

The demise of Google UA and the introduction of its G4 replacement should be regarded as a major opportunity and a negligible threat, despite the fact that Google, as you might expect, strongly encourages all users to switch to GA4 before the deadline.

Marketing attribution made worse

GA4 has only made Google’s marketing attribution worse, with deep frustration being expressed by many users trying to set it up, continuing use of data sampling, an historic data disconnect in July 2024, and black box attribution rules.

The fact is, GA4 lacks the functionality to make use of first-party data and does not have the complete range of media and sales channels as standard.

What’s the alternative?

The reality is that, if you ignore the hype around GA4, there are other options that marketers need to be aware of. Indeed, low-cost alternatives are available with full 100% browsing data being collected, through open-source technology, GDPR compliant first-party data and excellent browser dashboards.

At UniFida our customer journey-based marketing attribution is fully integrated with an open-source alternative to GA4. Within our platform we integrate offline channels, such as direct mail and call centres, as well as email service providers and CRM platforms, like Salesforce or HubSpot.

Example individual media customer journeys

The result? A fully transparent (every score, for every step, in every customer journey is available) marketing attribution solution that can also split results by different customer segments, including new and existing. It reports at a very high level, Return on Marketing Investment (ROMI) by channel by month, and at a micro level performance by individual campaign or UTM.

GA4 is not the only game in town. If you want to ensure total clarity around your marketing attribution, contact us today before time runs out.


UniFida logo

UniFida is the trading name of Marketing Planning Services Ltd, a London based technology and data science company set up in 2014. Our overall aim is to help organisations build more customer value at less marketing cost.

Our technology focus has been to develop UniFida. Data science business comes both from existing users of UniFida, and from clients looking to us to solve their more complex data related marketing questions.

Marketing is changing at an explosive speed. Our ambition is to help our clients stay empowered and ahead in this challenging environment.


Existing customers – why they don’t shop like prospects

It may not come as a complete surprise to be told that your existing customers behave differently from prospects – i.e. people who have never purchased from you before. In fact, the differences are very pronounced, especially when you look at customer journey patterns.

At UniFida we provide technology to help clients capture these customer journeys and then we use AI to analyse them. This enables the true value of different marketing investments to be understood and highlights the journey interactions that are most likely to be successful.

In our study of actual customer journeys, some of the findings are surprising. Possibly the biggest is that existing customers take longer journeys to the point of purchase than prospects. In fact, we found that not only are the journeys longer when measured in days from initial activity to final sale, but so too are the number of sales steps (events) in the journey.

Customer Journeys – New vs. Existing Example

customer type sales info

You can see from our analysis that existing customers take on average 29 days, whereas new customers take three days.

As the chart below shows, many prospects buy within just one or two sales events.

customer journeys diagram

Another key finding is that different channels work better for prospects than for existing customers. Search engines and TV can, for instance, be key for prospects, whereas direct channels like email and catalogues work better for customers.

Sales value by media chart

To some extent this is because catalogue and email are “channels of choice” for customer marketing, and hence drive more sales, but also pay per click (PPC) is used more often by prospects.

Different strategies

Given these facts, it’s clear that very different contact strategies are needed for the two different groups. As existing customers seem to prefer the long haul, the challenge is to keep them sufficiently interested during their journeys. This is where emails and texts come in, particularly when the customer has visited your website and not purchased, and also when you want to discourage them from using PPC by offering click-throughs from an email.

By contrast, prospects are more likely to swoop down on a purchase. They may have started their journey as unrecognised browsers, but when they come back to your website conversion techniques, such as website personalisation, become more important. When prospects are on your website there is no time to be wasted.

Example customer journeys

Below are some customer journey examples that illustrate these points. The top two journeys are for existing customers and show the interplay between different channels after a catalogue has been sent to them. We have chosen two particularly long journeys to allow more steps to take place before the purchase.

In the first journey, social media helped close the sale, whilst in the second it was email. Both existing customers used search even though they must have known the name of the company they were looking for, although they may have been looking for alternative suppliers at the same time.

Example: Existing Customer Journey 1

customer graph

Example: Existing Customer Journey 2

customer graph

The next two journeys for prospects (new customers) are much shorter. The top one started with the prospect searching and the sale being closed with an email, so he/she must have provided their email address on the website when visiting. In the second case there were two click-throughs from social media followed by a direct entry a day later.

Example: New Customer Journey 1

Customer type and channel graph

Example: New Customer Journey 2

Customer type and channel graph

What these charts reveal is just some of the complexity, often ignored, surrounding customer journeys and the importance of recording them so that they can be analysed.

By understanding which pathways lead to sales and which don’t, marketers have a far greater chance of making the right moves to convert prospects, and customers, to purchasing.


UniFida logo

UniFida is the trading name of Marketing Planning Services Ltd, a London based technology and data science company set up in 2014. Our overall aim is to help organisations build more customer value at less marketing cost.

Our technology focus has been to develop UniFida. Data science business comes both from existing users of UniFida, and from clients looking to us to solve their more complex data related marketing questions.

Marketing is changing at an explosive speed. Our ambition is to help our clients stay empowered and ahead in this challenging environment.


Marketing Metrics – why do they matter?

When it comes to measuring marketing success, there’s no doubt that marketing metrics are crucial.

Every company will have its own specific marketing metrics requirements. Analysing what these should be, and then having them delivered in a timely and reliable fashion, is vital for the success of every marketing department – and ultimately the company that it is serving.

To show the value of marketing metrics, let’s compare the fortunes of two different companies. Company A had a good set of accurate marketing metrics and used them well, while Company B had some faulty metrics and decided to be guided by them, with unfortunate consequences.

Company A

This company makes its own products and sells them directly to consumers globally. When the Covid pandemic hit they found that there was a massive upsurge in demand. By the end of 2020 they had sold 2.09 times more than the previous year. By the end of 2021 that had risen to 2.24 times.

However, their top priority was to manage supply and demand to keep the time lag between orders and delivery as tight as possible. This meant managing the amount spent on recruiting new customers and on communicating with existing ones.

Fortunately, they had historic marketing metrics that went back five years. These reported month-on-month sales from existing customers compared to new recruits, and which previous years those customers had come from. Once they knew how much the effects of Covid-19 was uplifting existing customer sales compared to previous periods, they could accurately forecast demand from existing customers for the rest of the year. This gave them a clear indication of the level of new recruits required to fill the factory capacity.

The net result? They were able to fill the factory whilst minimising their marketing spend and achieve a very strong ROMI (return on marketing investment).

Company B

This company also manages their own production, but they had a faulty metric. This was the sales value they were getting from customers to whom they had sent a catalogue. There were two reasons for this:

  • the lack of can accurate single customer view, which led to multiple duplicate records, and
  • an inaccurate match-back of those mailed to people ordering.

The result was that their metrics were reporting a much lower return – in fact, one-third of what it should have been on catalogue campaigns.

This led to a decision being made to abandon catalogues in favour of email communications. However, the company had not been particularly successful at collecting email addresses, and as a result there were only 14% of active customers for whom they had email addresses and who had not opted out.

Despite a very high volume of emails being despatched, the overall order rate in each year, from existing customers began to decline. Over a five-year period, it had sunk to a half of what it had been at the start.

However, because they were successfully recruiting new customers, the actual order value from existing customers kept going up, so nothing was noticed. In other words, instead of using the right metric – i.e. what proportion of the customers you start the year with go on to order in that year – they used the wrong metric, which was simply the absolute number of existing customer orders.

The net result was that Company B lost several million pounds worth of potential sales from existing customers, whilst not even understanding that this opportunity had been missed.

So, the value of accurate marketing metrics is clear. Analysis of those metrics is crucial to the success of your marketing activities – and your bottom line.


UniFida logo

UniFida is the trading name of Marketing Planning Services Ltd, a London based technology and data science company set up in 2014. Our overall aim is to help organisations build more customer value at less marketing cost.

Our technology focus has been to develop UniFida. Data science business comes both from existing users of UniFida, and from clients looking to us to solve their more complex data related marketing questions.

Marketing is changing at an explosive speed. Our ambition is to help our clients stay empowered and ahead in this challenging environment.


Marketing effectiveness – measuring the long-term impact of direct mail and other channels

In our previous blog post on return on marketing investment (ROMI) and seeing the bigger picture in terms of measuring the effectiveness of all marketing channels together, we explained why it is important to not only calculate return, but also track it over time.

The question is: what do you do if a marketing channel shows a declining trend, or if its ROI is less than other channels?

Pulling customers through the sales funnel

The temptation is to pull back tactically on that particular channel in favour of less expensive, and arguably more effective, channels. Moving the marketing budget to maximise effectiveness can happen frequently – however, most marketers know intuitively that channels can and should work together to pull customers through the sales funnel. This is often difficult to prove because media reporting is usually ‘last click’ only and/or is not granular or complete enough across all channels.

Some channels are more effective at influencing and raising awareness, others are better at converting and some work best in combination to keep the customer in the sales mindset. So, how do you prove this to a board of directors who may be looking for marketing budget cuts and who perhaps only see a sizable difference in cost of sale and ROMI between channels? And how do you know the longer-term impact of pulling back on some channels in favour of others that seem to be more effective?

Direct mail resurgence

Direct mail is a good example of a channel that, on the face of it, can be rather expensive and may be at the top of the list in terms of budget cuts. However, direct mail has seen a resurgence during the global pandemic period and, although it is still seen as expensive, it has some very interesting marketing characteristics.

Interestingly, in our recent blog post on measuring the carbon footprint of various marketing activities, Kg CO2 per sale for email was shown to be higher than for printed direct mail.

At UniFida, we have been studying direct mail results using our unique marketing attribution solution, which provides detailed ROMI over time for different channels. It also shows where in the sales funnel each channel is most effective with particular types of customers – i.e. existing customers, or those new to a brand.

Retail example

One of our retail clients is seeing some interesting results. In the graph below, direct mail in the form of catalogues is seen as most likely to impact sales in combination with another media channel and, by contrast, Search Engine is most likely to act on its own.

marketing channels working together graph

As this client expected, the ROMI for direct mail is lower than a number of other channels, but it is having the strongest influence at the start of the sales funnel – meaning that it is creating awareness, leading to new sales through encouraging steps, such as searching online and creating sales that otherwise would not have happened.

This is illustrated in the chart example below where the strength of direct mail activity is at the Initiator stage (the start of the sales funnel) against other channels. By comparison, for this company email has a stronger influence in the sales Closer stage.

Media influence in the sales funnel graph
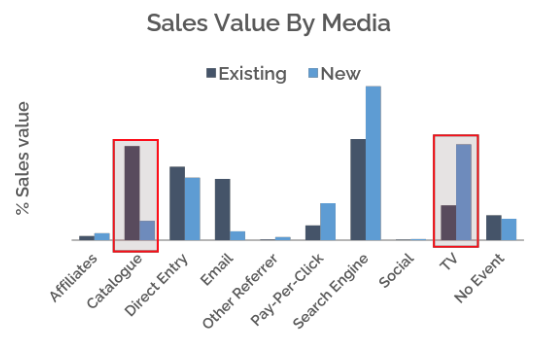
When we looked at the impact of media in converting new customers, the % influence of direct mail (catalogues) at the start of the sales funnel was even more pronounced, but email was less of a Closer and its influence on new sales was more evenly split across the sales funnel.

Quite often companies have individual contact details and permissions for direct mail and not for email, as customers find the former less intrusive. ‘Cold’ direct mail is also an option, with quality data providers offering targeted individuals with permissions to mail.

Speak directly to a targeted audience

Direct mail can work well for even the most complex propositions and, with third-party cookies being phased out, it represents an opportunity to speak directly to new, highly targeted audiences. It is also easy to test – however, it’s important to ensure that your measurement looks at the bigger picture in terms of ROMI.

Direct mail may also be adding to the effectiveness of the entire sales process, so you need to evaluate how it is bringing in more valuable customers than would otherwise be difficult to reach.

So, when looking at your marketing results, the challenge is to step back and examine the long-term impact of the marketing mix. For every channel you should consider the balance between individual channel ROMI, the interactions between channels and the role each is playing in funnelling sales.

Proof of concept

UniFida can deliver the required expertise and technology ‘out of the box’ to help you automate ROMI evaluation. We can start with a low-cost proof of concept to demonstrate how ROMI can be calculated for your business.

For more information email [email protected] or call + 44 203 9606472.


UniFida logo

UniFida is the trading name of Marketing Planning Services Ltd, a London based technology and data science company set up in 2014. Our overall aim is to help organisations build more customer value at less marketing cost.

Our technology focus has been to develop UniFida. Data science business comes both from existing users of UniFida, and from clients looking to us to solve their more complex data related marketing questions.

Marketing is changing at an explosive speed. Our ambition is to help our clients stay empowered and ahead in this challenging environment.


Return on marketing investment – the importance of seeing the bigger picture

To use a couple of sporting analogies, every marketer wants to score the equivalent of a bullseye or a hole in one. In other words, achieve a high score with the minimum effort. But just as in sport, it’s not always an easy task – however marketers can hit their targets by relying more on expertise and data, rather than just chance.

It starts with accurate media reports measuring the effectiveness of marketing efforts and investments. A lot of companies make do with media reports that are either not holistic – i.e. they focus on one channel and don’t take into account the existence and impact of other channels – or they are just a ‘snapshot in time’.

In other words, we need to look at the ‘bigger picture’ in terms of measuring the effectiveness of all marketing channels together, as well as any seasonal variations.

Be strategic

This approach should be strategic rather than tactical; companies need to look at marketing metrics in the longer term, rather than take the short-term view. Not looking out beyond the immediate horizon can result in:

  • missing a steady decline, or increase, in a channel’s performance
  • a lack of insight into the performance of each marketing channel at different times of the year, so not understanding seasonal impacts
  • not determining the ability for one channel to boost the performance of another when it is switched on
  • not recognising the impact of budget reductions in one channel on another.

It seems that few companies are stepping back and looking at trends over time, with all the channels measured together. Econometrics studies go some way towards helping to achieve this which, although useful, can be time-consuming and expensive. Also, they don’t provide a clear view of the effects of seasonal marketing activities.

More importantly the outputs don’t have the level of detail – such as campaigns and keywords – typically needed to optimise digital channels and direct marketing.

Optimise channels’ ROMI over time

What is needed is an attribution solution that provides detailed Return on Marketing Investment (ROMI) data over time, measuring digital and direct channels alongside each other, with the ability to drill down forensically into campaign detail.

Such a solution can even indicate at what stage of the sales funnel each channel and campaign are most effective and with which type(s)of customers – i.e. existing customers or those new to the brand. The ability to easily see such trends in marketing performance over the long term reveals a number of key truths, such as:

  • an overall decline or increase in the efficiency of all channels
  • natural variation in ROMI due to seasonality, and
  • the interaction (dependence or cannibalism) across different channels.

An attribution solution with built-in ROMI measurement over time enables marketing teams to step back and take a fresh look at their marketing budget and media mix. It empowers them to make well-informed, multi-channel decisions about how to drive more sales from the right types of customers and deploy the whole marketing budget more effectively.


UniFida logo

UniFida is the trading name of Marketing Planning Services Ltd, a London based technology and data science company set up in 2014. Our overall aim is to help organisations build more customer value at less marketing cost.

Our technology focus has been to develop UniFida. Data science business comes both from existing users of UniFida, and from clients looking to us to solve their more complex data related marketing questions.

Marketing is changing at an explosive speed. Our ambition is to help our clients stay empowered and ahead in this challenging environment.


How to measure ROMI (Return on Marketing Investment)

Marketing ‘bang for buck’ – how do you measure it?

Return on marketing investment (ROMI) is what every marketer wants to achieve. But automating marketing metrics and extracting accurate ROMI data can be a real challenge.


There are two key reasons for this: firstly, the lack of an agreed definition of ROMI (or indeed a methodology); and secondly, the absence of data and technology to extract and report on it accurately.

In terms of definition, ROMI evaluation can be done in the short or long term. Short term ROMI measures the return from immediate sales that you can associate with specific marketing activities. Long term ROMI also takes account the longer-term customer value that is derived from those sales, as well as the brand impact of advertising which can be monetised over a much longer period.

In this blog, we’re focusing on short term ROMI, specifically measurable results within a 90-day timeframe after online or offline direct marketing activities have taken place. (These are activities targeted at individuals, as opposed to indirect marketing activities, such as TV or press advertising).


Two types of short term ROMI

For short term ROMI, there are two different ways of calculating effectiveness:

Investment ROMI

This is the return that takes into account the full costs of marketing campaigns and includes all the measurable results within a 90-day period. We count the measurable benefit as the value that accrues to all the events in any customer journey leading to a sale that can be attributed to a marketing activity – for example, a sale of £X value after events such as responding to a social media advert, opening a follow-up email and visiting an ecommerce website via Google PPC.

We allocate the £X value across these three events according to the significance each has in contributing to the sale. The social media advert will receive its share of £X and this goes into the ROMI calculation for this particular activity.

marketing campaign investment graph

The table below shows a calculation of Investment ROMI. Marketing campaigns A, B, and C launched in January cost £30,000 total, however they impacted customer journeys that carried on until March. Campaign A contributed to a number of sales events that amounted to a combined value of £12,000 in January. The overall Investment ROMI calculation of 2.17 shows the combined return from all January campaigns.

calculation of marketing campaign investment ROMI

Sales ROMI

Sales ROMI looks at the return from the costs of the customer journey sales events that led to sales in a particular period. So, from the table below, sales in January amounted to £40,000, but the campaigns that caused the sales events to happen that led up to these sales may have been launched at any point in the 90-day window before each sale.

Sales ROMI graph

Following this approach, we look at the individual customer journeys that precede each sale in January and add up the costs associated with each journey’s sales events. These events may have been caused by a mix of online and offline campaigns that are also impacting sales in other months, such as December and February.

In the case of January, the sales events were all caused by campaigns A, B and C. Campaign A contributed 500 sales events, campaign B 2000 and campaign C 250. In terms of cost per sales event, campaign A contributed to a total of 2,700 events in this example and, if the campaign cost was £5,200, the cost per sales event is £2.

The value of sales of £40,000, divided by the combined sales events costs of £4,000 that caused it, produces the Sales ROMI calculation of x10 for January.


Delivering Investment and Sales ROMI metrics

Expertise and technology is needed to automate the ROMI evaluation process, knitting together all the different types of sales events and linking them to actual orders. The types of data required will normally include website browsing, e-commerce, emails, offline contact history and order processing.

UniFida’s automated approach is to use a Customer Data Platform (CDP) for data integration processes, but there are alternative platforms that deliver a similar result. It’s worth noting that for accurate evaluation you will need 100% of browsing activity data and not just the sample that Google Analytics provides (unless you buy the very expensive GA 360 at around $150,000 pa).

With the data assembled there are four key steps:

  1. Build a table of orders connected to all the sales events that are associated with them and with each sales event also linked to a campaign or a channel to be measured.
  2. Apply a weighting to each sales event so that the value of the order can be fairly attributed across these events. We find that on average there are around three sales events before each order and these can come from several channels. There is a huge amount of online information about weighting systems, much of which is not based on any science. We use Haensel AMS to provide our weighting algorithms due to the statistical research on which they are based and the fact that they can be applied at an individual order level. Some people use Markov Chains theory which is sound, but which can only work at the level of a substantial table of data and so is not good for evaluating individual campaigns or tests.
  3. Enter the costs of each individual campaign. These costs are essential and may be problematic where there are large numbers of campaigns, as often happens with emails. In this case, you may decide to enter costs at a channel level if you are looking at Investment ROMI. For Sales ROMI, individual campaign costs are required.
  4. At this point you can follow the logic in the tables above to calculate whichever flavour of ROMI you require.

What are the benefits?

There are multiple other measures such as impressions, opens, clicks, etc. which give an indication of the level of interest in a campaign. However, they all fail to answer the key question: was the marketing expenditure in itself justified?

The primary benefit is that ROMI calculations are the only way to fully and accurately justify investment in marketing campaigns.

ROMI provides a yardstick by which the performance of different campaigns and channels can be evaluated, and from that, informed decisions can be made about budget allocation. We are not suggesting that all budget allocation decisions should be based on ROMI, but where ROMI for a particular activity is low, you need to find other ways to justify the expenditure – for example, an activity may play a small but nevertheless important part in a significant number of sales.

ROMI can show how investment results vary at different times of year and hence guide you towards spending your budget where you are getting the best returns. For example, catalogues may do better in the colder months when people have more time indoors to study them.

There is one very important by-product of the ROMI calculations. If you regard the month-by-month ROMI results as a time series of information, then there will be periods when you have spent more or less in particular channels, with varying ROMI results. This data, when there is enough of it, will enable you to start constructing saturation curves that can show that, as you spend more in a particular channel, returns will go down, and vice versa.

Saturation curves are critically important for budget optimisation. Unless you know how changes in the level of budget for a channel impact their ROMI, it is simply not possible to plan with any certainty how best to shift budget between channels.

Proof of concept

UniFida can deliver the required expertise and technology ‘out of the box’ to help you automate ROMI evaluation. We can start with a low-cost proof of concept to demonstrate how ROMI can be calculated for your business.

For more information email [email protected] or call + 44 203 9606472.


UniFida logo

UniFida is the trading name of Marketing Planning Services Ltd, a London based technology and data science company set up in 2014. Our overall aim is to help organisations build more customer value at less marketing cost.

Our technology focus has been to develop UniFida. Data science business comes both from existing users of UniFida, and from clients looking to us to solve their more complex data related marketing questions.

Marketing is changing at an explosive speed. Our ambition is to help our clients stay empowered and ahead in this challenging environment.


You don’t have to let Google AdWords mark their own homework!

image showing data charts

The problem is that Google AdWords Conversion Metrics tell you the number and value of sales that come as the next action after landing on an Ad. What they do not tell you is how significant that action was in the stream of events that preceded each sale, and our finding is that the average number of events prior to a retail sale is between three and four.

Another issue here is that Google only tracks interactions with digital, so no account is taken of retail visits, call centre logs, catalogues sent, email opens etc.

This results in Google reporting a very inflated view of the significance of their ads.

One retail client of ours was spending a considerable proportion of their marking budget on Google Ads, but did not have confidence in the sales results they were reporting.

We analysed their Google Analytics data feed and discovered that by looking at just the online events, and just the last clicks, as Google does, that Google Ads (or Pay per Click as it used to be) could claim an astonishing 39% of the value of all sales.

a table showing attribution for google adwords
google adwords attribution image

However, when we took the Google Analytics event feed, and merged it with all the clients other online and offline events data, the UniFida approach to multi-channel attribution got to an entirely different attribution outcome. In this case the Google PPC share of order value was reduced to 8%.

image highlighting that google adwords does not cover full attribution
artificial intelligence driven attribution

The UniFida approach is to look at all the events that take place in a 90-day window before a sale and then to use AI to weight the significance of these events. In this way something that happened through a specific channel 30 days before a sale gets a weighting that is different to something that happens via another channel on the day of the sale. This weighting is determined by statistical analysis using artificial intelligence developed by our data science engineers.

Because customers control their own journeys, reliance on first or last click as the only driver behind an order is absurd, hence the requirement for AI to attribute the correct significance to each event. Almost half of all advertising expenditure is offline so, omnichannel attribution must include offline as well as online.

Are you interested to find out which parts of your marketing are not working as well as the bits that are?

Are customer data platforms affordable?

To determine if customer data platforms are affordable, will depend on who you are and who you are talking to. But if you are a typical large US enterprise then a reasonable cost for a CDP could be around $1m per annum.

Not many UK companies would be happy to pay that much, even if it did only amount to a few pence per customer.

We are concerned that there is a perception that CDPs are like private jets, the preserve of the very rich. In reality, CDPs come in many shapes and forms and to some extent this affects what they cost.

How much does a customer data platform cost?

We would like to feel that our cloud-based customer data platform is both functionally very rich, and at the same time extremely affordable. For instance, if you have 100,000 customers, would paying 27p per customer per annum be too much?

But more importantly than the cost, CDPs, if deployed well are a great investment. For instance, if your average margin on goods you sold was £20, then you would only have to sell one extra item for one in every 75 of your 100,000 customers to pay for your CDP.

Our clients have given us feedback on their returns from investing in our CDP, and they are seeing an increased contribution of between x4 and x8 the cost.
customer reviews on customer data platform affordability

We offer a free business evaluation service where we help you identify the use cases for a CDP, and then quantify the results.

Would you like to arrange a chat with us about this? Just email us and we can arrange a Zoom meeting.


UniFida logo

UniFida is the trading name of Marketing Planning Services Ltd, a London based technology and data science company set up in 2014. Our overall aim is to help organisations build more customer value at less marketing cost.

Our technology focus has been to develop UniFida. Our data science business comes both from existing users of UniFida, and from clients looking to us to solve their more complex data related marketing questions.

Marketing is changing at an explosive speed, and our ambition is to help our clients stay empowered and ahead in this challenging environment.


Are customer value metrics the backbone of your marketing?

It’s intuitively obvious that they should be, but what may not be so clear are which actual metrics you need, and how to connect them to different areas of your business decision making processes. Let’s take four key ways in which you can take advantage of customer value metrics.


1. High-level business planning

Your turnover is equal to the sum of the customer value provided in any period. So, to look forward to how your customer value is going to be provided in the future you need to be able to project from your current customer base, remove those that are going to attrite, and add those that you are going to recruit.

The metric to support this is the average value per customer in each year since they were recruited. So how much value in their first, second third year etc. This allows you to very easily roll customer value forward for planning purposes.

When you start from your planned turnover in say next year, you can then tell how much of that is going to be provided by the exiting customer base, and how much will need to be provided by how many new recruits.

You will also want to apply some assumptions about how value is going to be altered by improvements to the way you look after your customers, and then you will have the basics of a customer-based business plan.


2. Understanding which customer groups provide what level of value

You will be very aware that not all customers are equal when it comes to their level of spend with you.

So, you will need to dissect your average customer value by the type of customer they are. Factors such as age, gender, and product categories purchased can all be used to profile the value of your customers.

The benefit then is that you will know what groups to target your recruitment efforts at.


3. Examining the customer value provided by different channels and media

This type of analysis leads you directly to understanding the ROI provided by different channels and media.

Indeed, we like to use a metric which is the amount of longer-term customer value derived from every £1000 spent in a particular recruitment mode.

You can undertake this at a very micro level, such as individual media, or more macro level, such as a channel.

There is though a caveat; many customers are now recruited as a result of contacts from multiple channels. However, this does not prevent you from looking at the customer value obtained from each recruit for whom the channel has played a part.


4. Where to focus retention?

This is a harder question to answer as your higher value customers will often be the most loyal.

What you need to know is which of your higher value customers are more at risk than others.

For this you will need an individual level predictive model for risk of attrition with which to score customers, and find the higher value, higher risk, group.


Some conclusions

  • Understanding all aspects of longer-term customer value is critical for every successful marketeer.
  • To achieve this, you need a single customer view that can track customer behaviour through time.
  • You will then need to be able to obtain the metrics.
  • It won’t come as a surprise to regular readers of our newsletters that our customer data platform UniFida has been designed to provide most of the metrics we have been describing on demand.

In some cases further analysis will be required, and our data scientists are happy to help with this.


If you would like to talk to us about how to get the customer metrics you need, then please email to say when and how you would like to be contacted.


UniFida logo

UniFida is the trading name of Marketing Planning Services Ltd, a London based technology and data science company set up in 2014. Our overall aim is to help organisations build more customer value at less marketing cost.

Our technology focus has been to develop UniFida. Our data science business comes both from existing users of UniFida, and from clients looking to us to solve their more complex data related marketing questions.

Marketing is changing at an explosive speed, and our ambition is to help our clients stay empowered and ahead in this challenging environment.


3 problems that can arise when allocating marketing budget according to campaign ROI

What could possibly go wrong when allocating marketing budget according to campaign ROI? Well, depending on exactly how you do that, quite a lot actually!


Here are just three examples

  1. If you approve any campaign expected to provide an ROI > X you may be approving campaigns for which there may be alternatives that yield better X+++ returns. These may be different types of campaign with the same objective, or for instance the same campaign but just run at a different time of year.
  2. It’s well known that all channels can suffer from over-use or saturation, at which point their ROI will start to drop. Just think of the irritation caused by a TV advert repeating too often. But if you cannot tell what the cumulative ROI of all your campaigns in a channel is, how are you going to be able to measure this effect, and know when to reduce spend in one channel or increase it in another?
  3. Campaigns don’t just happen in isolation; they happen within the context of all the other campaigns that are happening at the same time, each of which may have an impact on a potential customer. Hence you spend on DRTV will impact your returns from direct mail or door-drops. Understanding the impact of your main channels on other channels can become critical.

So, how do you resolve these issues and get to the point where allocating your marketing budget takes account of them?

We have developed a process, and related technology, that is designed to help you get to this point. The way it works in detail varies with each client, because no two clients share the same marketing campaign mix, but the outcome will be that you have a marketing budget that should get you the best possible return.

Contact us for more information and a no-obligation chat.


UniFida logo

UniFida is the trading name of Marketing Planning Services Ltd, a London based technology and data science company set up in 2014. Our overall aim is to help organisations build more customer value at less marketing cost.

Our technology focus has been to develop UniFida. Our data science business comes both from existing users of UniFida, and from clients looking to us to solve their more complex data related marketing questions.

Marketing is changing at an explosive speed, and our ambition is to help our clients stay empowered and ahead in this challenging environment.